
GO TO SIMULATION : click here
As ressources grow scarce on earth, most society will have to review their lifestyle in order to even survive on the long term. While there are a multitude of sociological theories on how humans should behave in a group, the most prevalent one is a capitalistic society where everyone is forced to fight for themselves. In 1938 already, a swiss author named Hans Widmer, more commonly known as his pseudonym P.M. , wrote a book called bolo'bolo. In this book, he describes a society built around autonomous communities that would help each others. From this book, a team of researcher at the University of Applied Sciences and Arts Northwester Switzerland Academy of Art and Design built a project called Thinking Toys for Commoning. One of the axis of the project, was to build an Agent Based Model to simulate the working patterns of a co-housing community. Our task was to build a meaningful visualization that would help them to notice the tipping points in the simulation.
As mentionned above, we were tasked with creating a way to identify tipping points in the simulation. To do this we had to keep in mind two concepts :
A leverage point is a parameter or a place in the simulation that can lead to some major changes.
A tipping point is a the value of a parameter in the simulation where where a major change occurs.
The main audience we wanted to reach with this visualization was the research group that started the project. //complete.
This is a particuliar part of our project, we did not have a specific dataset given. Instead we were given the program that could simulate the ABM. The simulation yielded various type of output values and had a few input values. To abstract it as a function we can split the ABM as a function with inputs and outputs.
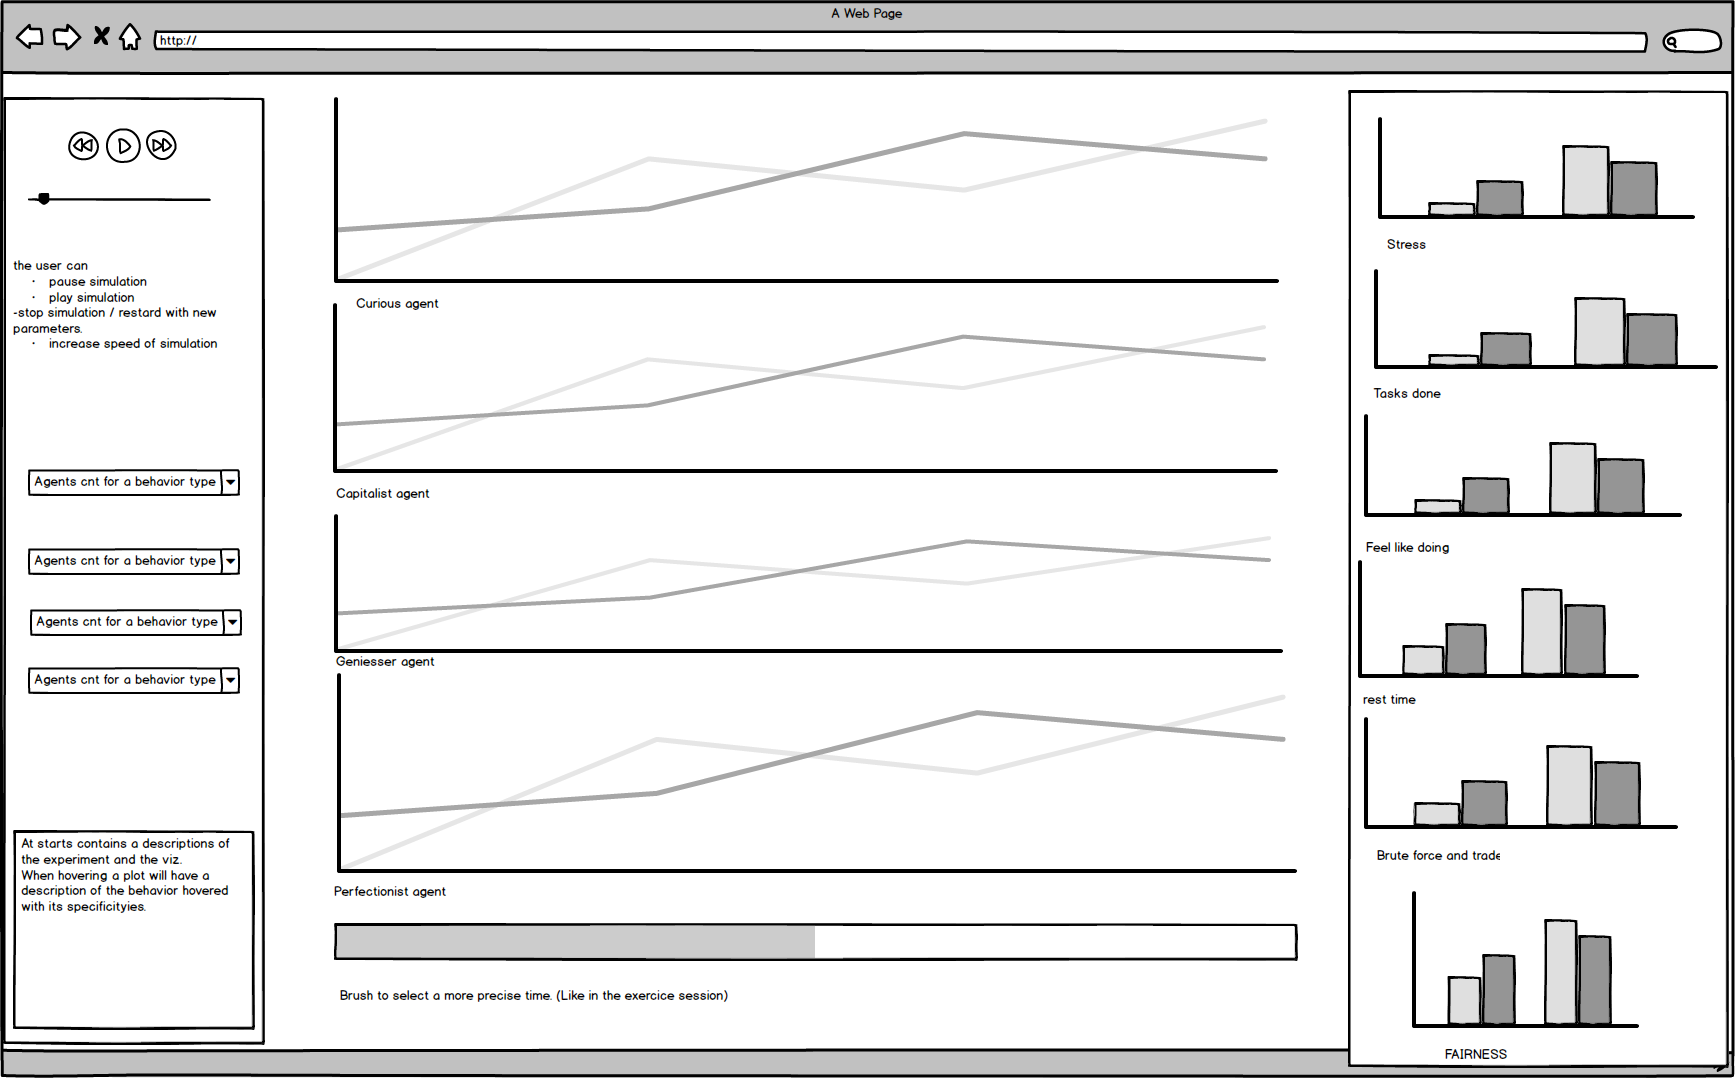
The user of the simulation can choose how many agents of each behavior type he wants and how many tasks should be given by the simulation. This way the user can tweak those values to see if any emerging patterns appear.
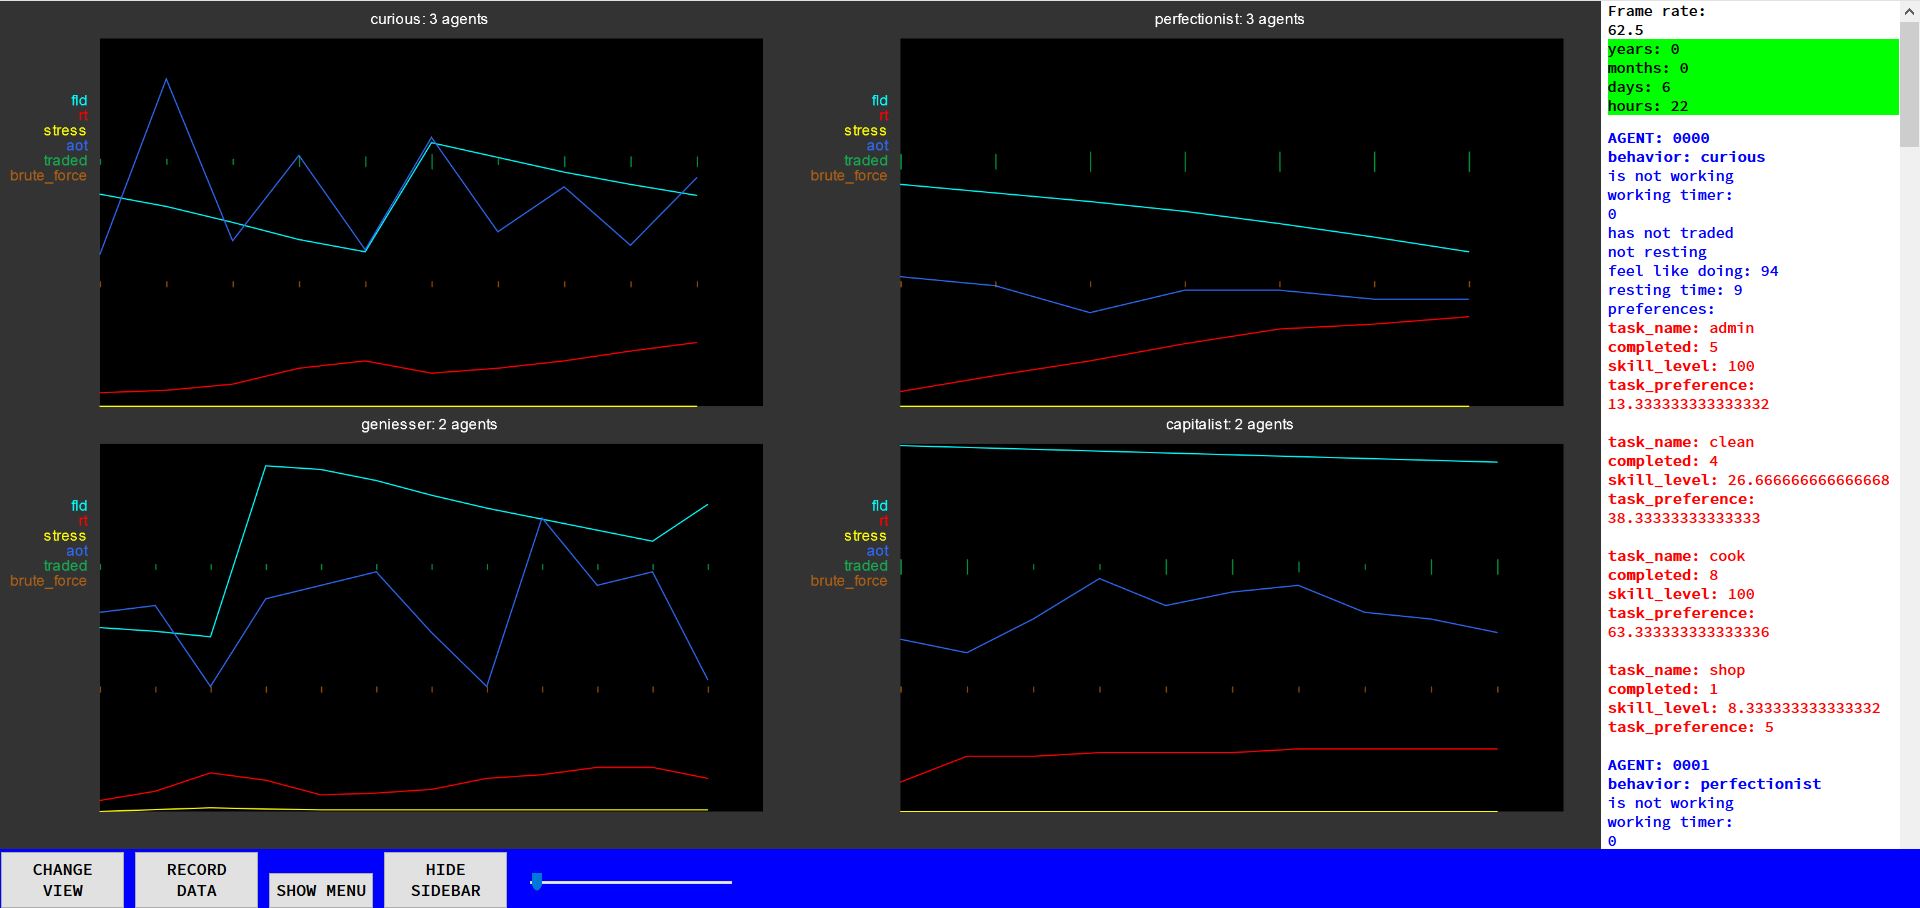
The simulation computes those values depending on the behavior type of the agent. For example, a perfectionist agent wants to do always the same task, forcing this agent to do a task that he has no preference for will decrease his "feel like doing" value. Brute force value refers to if the agent was forced into doing the task even if he did not want to do it.
Agent based modeling is a wide area of research, therefore there are many existing visualization of agent based modeling. The original research team that did the modeling already had created a visualization to see the existing data. Therefore we had a few already existing inspirations to look into.
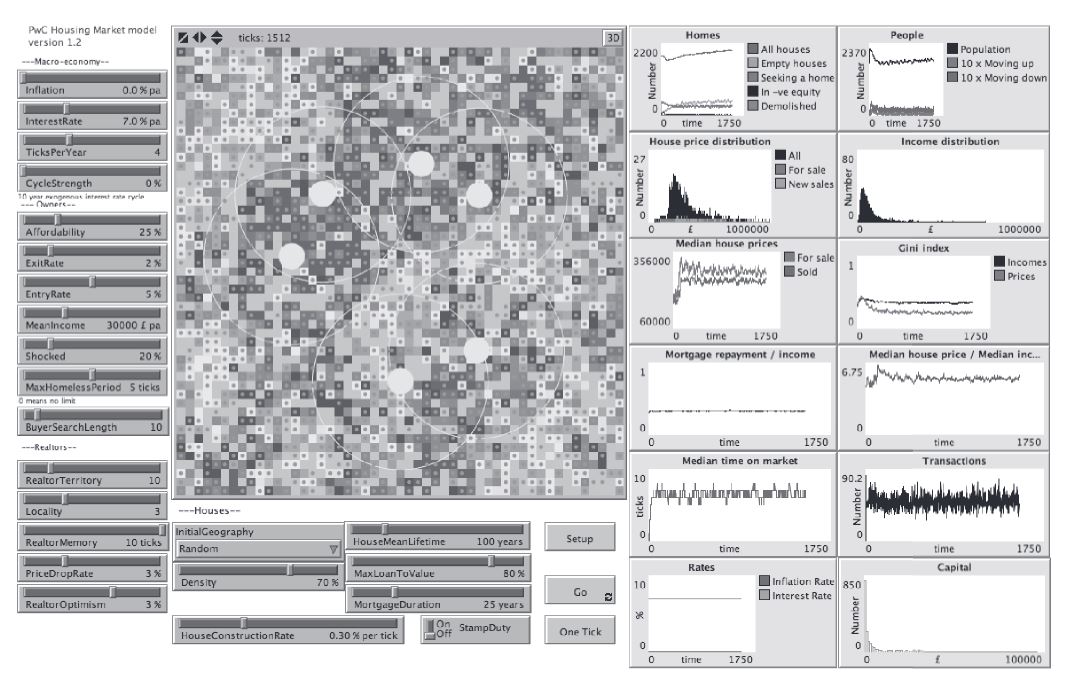
The first exisiting visualization shows the historical evolution of the output values over time. However it does not offer an overview of the current situation. An other option that we would like to improve on is the customization of the parameters. The Fig.3 shows an existing visualization of an Agent Based Modeling. We can see on the left side there is the option to modify many parameters, and on the right side the results of the simulation. We wanted to reach a visualization similar to this figure, that would look like a control pannel for the user to work with.
Our first idea was very relient on the inspiration we had in Fig.3. It was a very basic draft of how we could show the visualization. However, as we had not discussed with the person in charge of the project yet, we weren't sure if the direction we were taking was correct. Therefore, we had to modify a little bit our initial idea to have the visualization focus on the tipping points and emerging patterns in the simulation, rather than just depict the current situation.
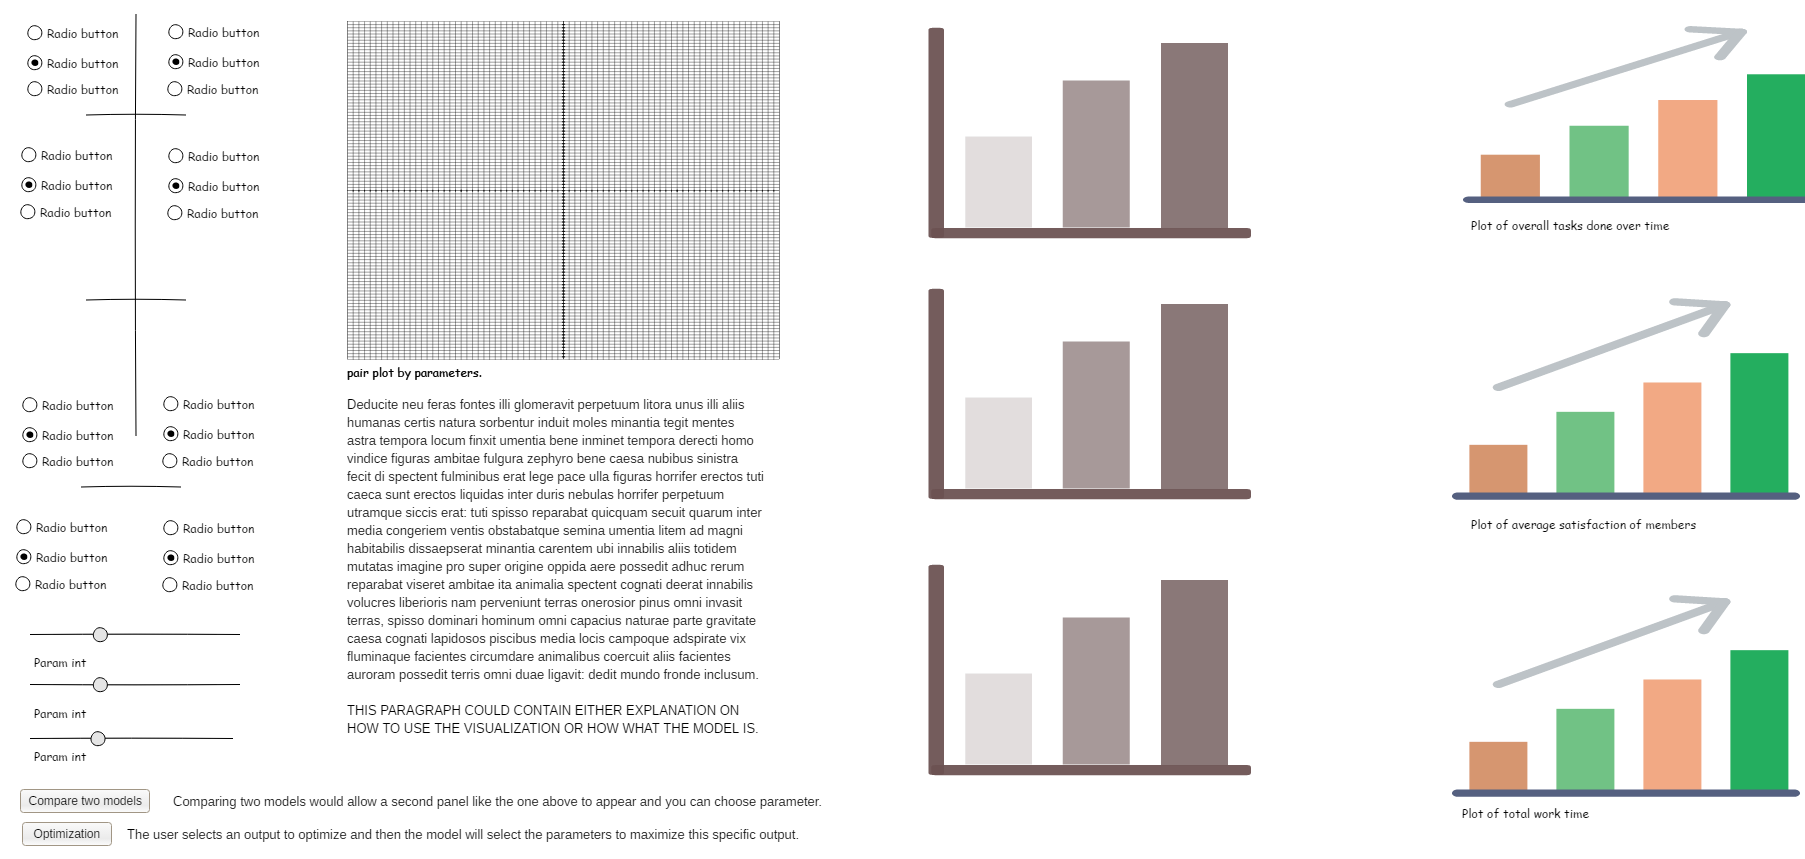
After discussing with the Professor Savic, we decided to take a different path with our visualization and focus mainly on two axis : the current situation , and a historic snapshot. So we had to have three main ideas in our visualization : parameters modification, current situation and historic snapshot. This led us to our second idea for the visualization.
While this was a satisfying first goal to reach, we now wanted to add more options into our visualization. //TODO finish writting.
We mainly worked with the D3.js library up until now. We had full access to the code of the model so our first task was to work a way to have them work together. As the current project uses the P5.js library, removing full usage of it was not deemed acceptable as we want our visualization to be as much as possible compatible with the original code. This will also help future modification on the code of the model. If we implement our visualization as a independent module, future engineers could modify the model as they wish and still have a functionning way to see the results. //TODO finish